
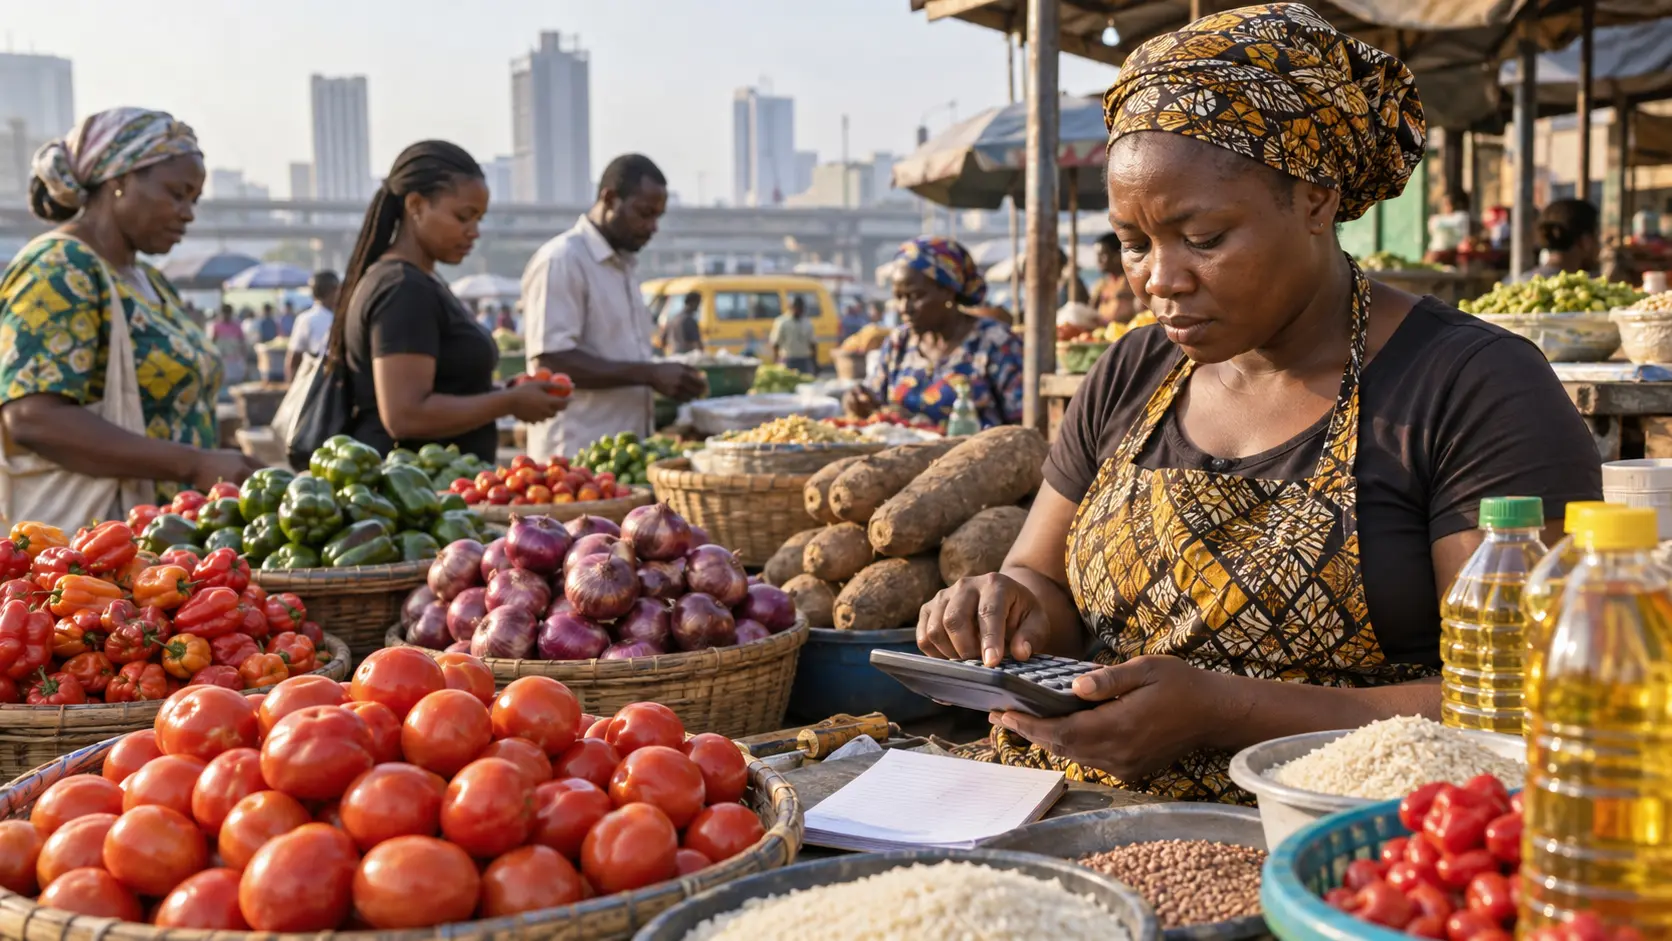
Nigeria's headline inflation rate eased to 15.39% year-on-year in August 2026 from 15.43% in July, the National Bureau of Statistics said in a Consumer Price Index report released on Tuesday, 15 September. The movement was only 0.04 percentage point, so the headline describes a marginal moderation rather than a sudden change in household costs.
The monthly measure slowed more visibly. Average consumer prices rose 0.71% between July and August, compared with a 1.57% increase between June and July. The CPI itself moved to 146.3 points from 145.3, confirming that the general price level continued to rise even as the pace weakened.
A slower rise is not a fall in prices
That distinction is essential. A lower inflation rate does not mean goods and services became broadly cheaper; it means their measured average price increased more slowly. Families can therefore experience continuing strain even when the national inflation line points down.
The August annual rate was also below the 23.14% recorded a year earlier. Year-on-year comparisons reflect both current price changes and the level of the index in the comparison month, so the drop should not be read as a measure of recovered purchasing power or a reversal of earlier price increases.
Food inflation slowed to 19.57% year-on-year from 20.31% in July. On a monthly basis, food inflation fell sharply to 1.02% from 5.56%. The bureau associated the moderation with changes in the average prices of items including palm oil, pepper, onions, cassava flour, beef, yams, fresh fish, wheat grain and poultry.
Food, core and household pressure
Even after that slowdown, food and non-alcoholic beverages remained the largest contributor to annual headline inflation at 6.16 percentage points. Restaurants and accommodation services contributed 1.99 points, transport 1.64 points, and housing, water, electricity, gas and other fuels 1.30 points. These are contributions to the overall rate, not separate price increases to add together.
Core inflation, which excludes volatile farm produce and energy prices, eased to 13.29% year-on-year from 14.97% in July. Its month-on-month reading was -0.06%, compared with 0.15% in July. That national estimate suggests softer underlying pressure in August, but one monthly reading does not by itself establish a lasting trend.
The urban and rural figures moved differently. Urban inflation eased to 15.88% year-on-year from 16.12%, while rural inflation increased to 14.23% from 13.77%. Month-on-month urban inflation slowed to 0.28%, but the rural measure rose to 1.79% from 0.78%.
Urban and rural paths diverged
The divergence matters because transport, harvest conditions, local supply chains and household spending patterns can transmit price pressure differently outside major cities. The national headline can improve while some communities experience faster increases over the same month.
State results also varied widely. Lagos had the highest reported headline rate at 23.68%, followed by Zamfara at 22.56% and Enugu at 22.06%, while Sokoto recorded 2.11%. For food, Adamawa recorded 38.85%, Zamfara 37.96% and Bayelsa 36.20%. NBS cautions that different consumption patterns and index weights make simple state rankings potentially misleading.
Nigeria now calculates the CPI with 2024 as its price reference year and 2023 as the weight reference period. The rebased basket covers 934 product varieties across 13 consumption divisions. That update is designed to reflect newer spending patterns, and comparisons should use the official rebased series rather than splice the current readings casually onto the old index.
How to read the rebased series
For households, the next useful evidence will be whether the slower monthly pace persists across food, transport, housing and services. For policymakers and businesses, the August release provides a clearer direction of travel, but it does not guarantee a particular interest-rate decision, exchange-rate outcome or improvement in real incomes. Those claims require separate evidence.